Bioinformatics
Test Task
Klim Kostyuk
0. Preprocessing
Mean gene expression distribution
Before filtering:
Mean gene expression distribution
After filtering:
1. Differential expression
analysis
Luminal A breast cancer (LumA)
4782 DEGs (17.25%)
1229 DEGs (4.43%)
Luminal B breast cancer (LumB)
6706 DEGs (24.19%)
1225 DEGs (4.42%)
Her2-Enriched breast cancer (Her2)
6413 DEGs (23.14%)
2176 DEGs (7.85%)
Basal-like breast cancer (Basal)
6619 DEGs (23.88%)
4007 DEGs (14.46%)
Normal-like breast cancer (Normal)
4949 DEGs (17.85%)
161 DEGs (0.58%)
2. Dimension reduction
and visualization
Principal Component Analysis (PCA)
Differentially expressed genes subset shows the best clusterization of PAM50 subtypes
PCA scree plot
First 2 components of PCA explain only ~16% of variance
PCA by tissue type
t-Distributed Stochastic Neighbor Embedding (t-SNE)
t-SNE better distinguishes Luminal A and Luminal B subtypes
PCA + t-SNE
Adding PCA (`n_components` explaining 80% of variance) before t-SNE led to a more distinguished representation of subtypes
Uniform Manifold Approximation and Projection (UMAP)
UMAP captures global tendencies better than t-SNE
3. Classifier for the
breast cancer patients
based on PAM50 subtypes
Comparing the performance of classifiers
With all genes as features:
| Classifier | Accuracy | Precision | Recall | F1-score | ROC AUC |
|---|---|---|---|---|---|
| Gradient Boosting | 0.830 | 0.789 | 0.830 | 0.809 | 0.900 |
| Random Forest | 0.805 | 0.764 | 0.805 | 0.778 | 0.931 |
| Logistic Regression | 0.774 | 0.767 | 0.774 | 0.765 | 0.926 |
| SVM | 0.767 | 0.731 | 0.767 | 0.744 | 0.920 |
| Neural Network | 0.761 | 0.726 | 0.761 | 0.743 | 0.855 |
| AdaBoost | 0.704 | 0.702 | 0.704 | 0.700 | 0.889 |
| Naive Bayes | 0.692 | 0.673 | 0.692 | 0.680 | 0.773 |
| KNN | 0.623 | 0.639 | 0.623 | 0.548 | 0.771 |
With only DEGs as features:
| Classifier | Accuracy | Precision | Recall | F1-score | ROC AUC |
|---|---|---|---|---|---|
| Gradient Boosting | 0.818 | 0.779 | 0.818 | 0.797 | 0.916 |
| Random Forest | 0.805 | 0.764 | 0.805 | 0.780 | 0.938 |
| SVM | 0.792 | 0.758 | 0.792 | 0.772 | 0.921 |
| Neural Network | 0.774 | 0.737 | 0.774 | 0.751 | 0.865 |
| Logistic Regression | 0.761 | 0.724 | 0.761 | 0.741 | 0.909 |
| Naive Bayes | 0.748 | 0.746 | 0.748 | 0.739 | 0.823 |
| AdaBoost | 0.730 | 0.694 | 0.730 | 0.711 | 0.850 |
| KNN | 0.660 | 0.642 | 0.660 | 0.611 | 0.827 |
F1-score
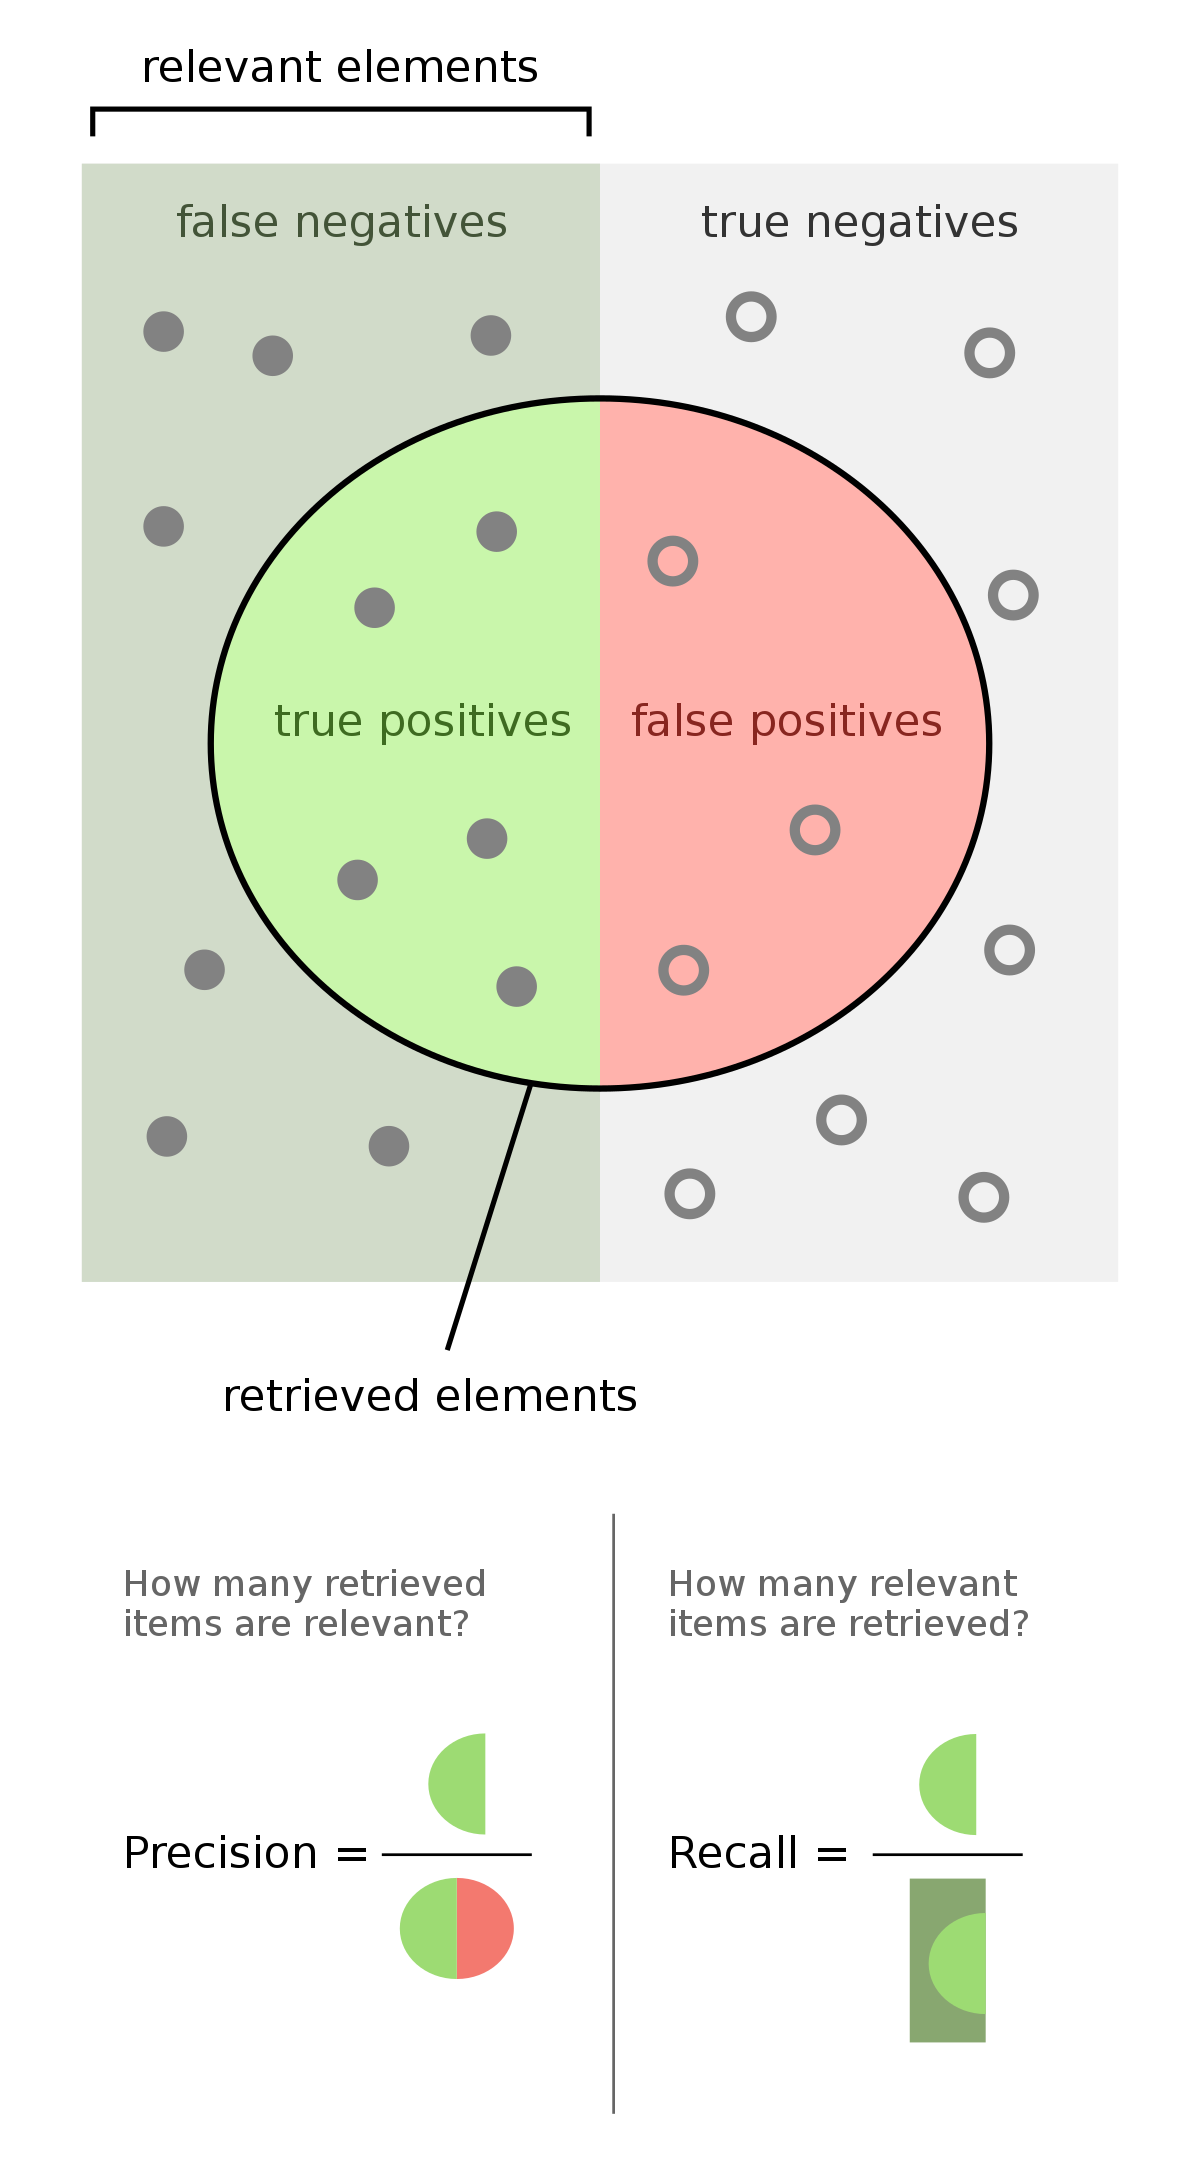
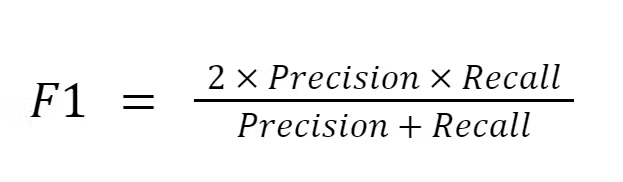
Why choose F1-score?
- High cost of false positive and false negative predictions
- Low sensitivity to imbalanced datasets
- Precision and recall are both important
Tuning the hyperparameters of chosen classifiers
            classifiers_degs = {
                'Random Forest': RandomForestClassifier(random_state=42),
                'SVM': make_pipeline(StandardScaler(), SVC(probability=True, random_state=42)),
                'Gradient Boosting': HistGradientBoostingClassifier(random_state=42),
            }
Gradient Boosting:
            param_space_gb = {
                'learning_rate': [0.01, 0.1, 0.2],
                'max_iter': [100, 200, 300],
                'max_leaf_nodes': [21, 31, 41]
            }

            grid_search_gb = GridSearchCV(
                classifiers_degs['Gradient Boosting'],
                param_space_gb,
                n_jobs=-1,
                scoring='f1_weighted',
                verbose=1,
            )

            grid_search_gb.fit(X_train, y_train)

            print(grid_search_gb.best_params_)
            print(grid_search_gb.best_score_)
Random Forest:
            param_space_rf = {
                'n_estimators': [100, 200, 300],
                'max_features': ['sqrt', 'log2', None],
                'max_depth': [None, 10, 20, 30]
            }

            grid_search_rf = GridSearchCV(
                classifiers_degs['Random Forest'],
                param_space_rf,
                n_jobs=-1,
                scoring='f1_weighted',
                verbose=1,
            )

            grid_search_rf.fit(X_train, y_train)

            print(grid_search_rf.best_params_)
            print(grid_search_rf.best_score_)
SVM:
            param_space_svm = {
                'svc__C': [0.1, 1, 10],
                'svc__gamma': ['scale', 'auto'],
                'svc__kernel': ['linear', 'poly',
                                          'rbf', 'sigmoid']}

            grid_search_svm = GridSearchCV(
                classifiers_degs['SVM'],
                param_space_svm,
                n_jobs=-1,
                scoring='f1_weighted',
                verbose=1,
            )

            grid_search_svm.fit(X_train, y_train)

            print(grid_search_svm.best_params_)
            print(grid_search_svm.best_score_)
Choosing a classifier
              classifiers = {
                  'rf1': RandomForestClassifier(
                      **{'max_depth': None, 'max_features': None,
                          'n_estimators': 100}),
                  'rf2': RandomForestClassifier(
                      **{'max_depth': None, 'max_features': None,
                          'n_estimators': 300}),
                  'gb': HistGradientBoostingClassifier(
                      **{'learning_rate': 0.1, 'max_iter': 200,
                          'max_leaf_nodes': 31}),
                  'svm': make_pipeline(StandardScaler(), SVC(
                      **{'C': 0.1, 'gamma': 'scale', 'kernel': 'linear'}))
              }

              rkf = RepeatedKFold(n_splits=5, n_repeats=5,
                                  random_state=42)

              scores = {}
              for name, clf in (pbar := tqdm(classifiers.items())):
                  pbar.set_description(name)
                  scores[name] = cross_val_score(
                      clf, X_train, y_train, cv=rkf,
                      n_jobs=-1, verbose=2,
                      scoring='f1_weighted')
Choosing Random Forest with 100 estimators, as its performance is not significantly worse
than RF with 300 estimators or Gradient Boosting, but it is less computationally expensive
Test results of the chosen classifier
| precision | recall | f1-score | support | |
|---|---|---|---|---|
| Basal | 0.92 | 0.92 | 0.92 | 25 |
| Her2 | 0.67 | 0.75 | 0.71 | 8 |
| LumA | 0.84 | 0.93 | 0.88 | 68 |
| LumB | 0.90 | 0.84 | 0.87 | 51 |
| Normal | 0.50 | 0.14 | 0.22 | 7 |
| | ||||
| accuracy | | | 0.86 | 159 |
| macro avg | 0.76 | 0.72 | 0.72 | 159 |
| weighted avg | 0.85 | 0.86 | 0.85 | 159 |
Feature importance
- Based on the mean decrease in impurity (Gini importance)
- Computationally inexpensive
- Easy to interpret
- Biased toward high cardinality features
- Unequally distributes importance between highly correlated features
- Based on feature permutations
- Measures the direct impact of each feature
- Easy to interpret
- Reduces importance of highly correlated features*
- Computationally expensive
- Based on SHAP (SHapley Additive exPlanations) values
- Provides a consistent and accurate measure of feature importance
- Accounts for feature interactions and provides local interpretability
- Computationally expensive
- More complex
* The impact of correlation was reduced by clustering features using Spearman correlation and silhouette scores,
retaining only a core feature from each cluster.
Identifying key genes in Luminal A breast cancer
TPX2, CENPA, ESR1, KRT14, SGOL1, KRT5 (highlighted in bold)
were ranked among the top 10 features
in at least 2 feature importance evaluation techniques
Biological role of identified key genes in Luminal A breast cancer
Luminal vs other:
- TPX2 is associated with poor prognosis in luminal breast carcinoma; knockdown of TPX2 impacted the cell cycle and colony formation in MDA-MB-231 cells (Kahl et al., 2022).
- Mutations in ESR1, particularly in the ligand-binding domain, lead to endocrine therapy resistance by causing constitutive receptor activity, contributing to poorer patient outcomes in luminal breast cancer (De Santo et al., 2019).
- In many breast cancer models, luminal cells that express basal cell markers, including KRT14, become the leaders of invasion (Khalil et al., 2024).
- KRT5 and KRT14 expression in luminal breast cancer are associated with a basal-like phenotype, tumor heterogeneity, and poor prognosis due to their roles in cancer stem cell properties (Li et al., 2022).
Luminal A vs B:
- CENPA was identified in an mRNA signature correlated with a lower survival ratio in luminal A breast cancer and not in luminal B (Xiao et al., 2018).
- CENPA and FOXM1 are key transcription factors, driving cell cycle, proliferation, and poor outcomes in luminal A breast cancer (García-Cortés et al., 2021).
Identifying key genes in Luminal B breast cancer
KRT5, ESR1, TPX2, KRT14, MLPH, SGOL1, NEIL3 (highlighted in bold)
were ranked among the top 10 features
in at least 2 feature importance evaluation techniques
Biological role of identified key genes in Luminal B breast cancer
- Mostly the same key genes as in luminal A subtype except for CENPA.
- KRT5, SFRP1, and KRT14 were downregulated in all TNBC samples, and these changes are more likely to be characteristic of the luminal B subtype, according to (Ossovskaya et al., 2012).
- EGFR expression was higher in luminal B than in luminal A subtype and was associated with poor prognosis in ER+ breast cancers (Jeong et al., 2019).
Identifying key genes in Her2-Enriched breast cancer
Only ESR1 (highlighted in bold)
was ranked among the top 10 features
in at least 2 feature importance evaluation techniques
Biological role of identified key genes in Her2-Enriched breast cancer
- HER2 (ERBB2) is over-expressed in HER2-enriched subtype compared to basal-like and luminal breast cancer subtypes (Tishchenko et al., 2016).
- ESR1 is under-expressed in Her2-enriched and basal-like subtypes compared to luminal breast cancer subtypes (Tishchenko et al., 2016).
- GRB7 expression in invasive breast cancer correlates with markers of a more aggressive phenotype, including HER2 overexpression, a greater degree of HER2 amplification, ER negativity, and p53 positivity (Bivin et al., 2017), also it is an independent predictor of progression free survival (Luoh et al., 2009).
- STARD3 is overexpressed in HER2-positive breast cancer and is associated with poor prognosis and treatment response, making it a potential diagnostic and prognostic biomarker for this subtype (Lodi et al., 2023, Fararjeh et al., 2021).
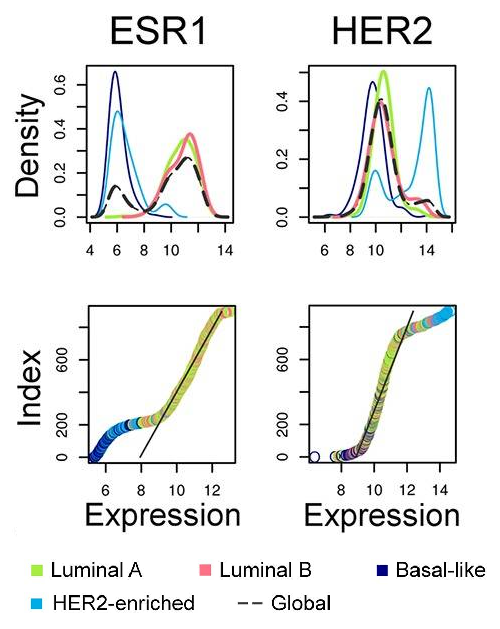
ESR1 and HER2 expression in various breast carcinoma subtypes defined by PAM50 assay (Tishchenko et al., 2016).
Identifying key genes in Basal-like breast cancer
MLPH, FOXA1, ESR1, TTC6, HJURP (highlighted in bold)
were ranked among the top 10 features
in at least 2 feature importance evaluation techniques
Biological role of identified key genes in Basal-like breast cancer
- MLPH and FOXA1 are under-expressed in basal-like subtype compared to luminal and Her2-enriched breast cancer subtypes (Tishchenko et al., 2016).
- FOXA1 represses basal gene expression and improves survival by inhibiting EMT and cell proliferation (Seachrist et al., 2021, Liu et al., 2024).
- LINC00504 is associated with better prognosis in basal-like breast cancer subtype (Mathias et al., 2021).
- HJURP was overexpressed in Basal II subgroup, associated with poor prognosis, and regulates DNA repair and chemo-resistance in TNBC (Milioli et al., 2017, Mao et al., 2022).
- Couldn't find any information regarding biological role of TTC6 in basal-like breast carcinoma, but it is involved in TTC6–MIPOL1 gene fusion, preferentially present in luminal B subtype (Lee et al., 2020).
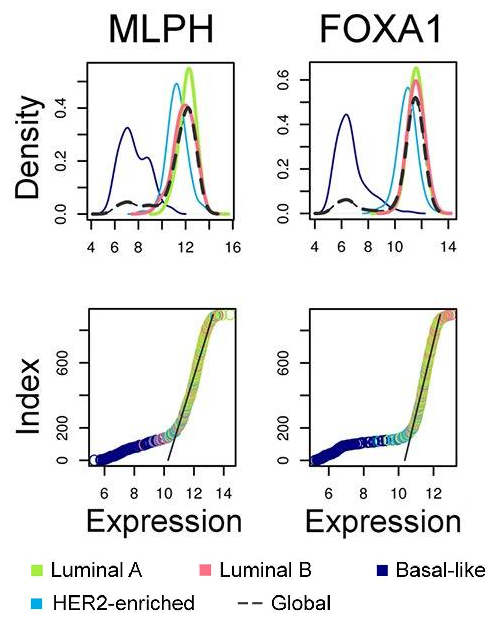
MLPH and FOXA1 expression in various breast carcinoma subtypes defined by PAM50 assay (Tishchenko et al., 2016).
Identifying key genes in Normal-like breast cancer
ESR1, TPX2, KRT14, KIF20A (highlighted in bold)
were ranked among the top 10 features
in at least 2 feature importance evaluation techniques
Biological role of identified key genes in Normal-like breast cancer
- Normal-like breast cancer subtype is still not well understood.
- Given the classifier's poorest performance on this subtype, the most important features identified are unreliable.
- From the top 10 genes identified via all three feature importance techniques only KIF20A was found in the context of normal-like breast
cancer subtype:
KIF20A mRNA levels were a negative prognostic indicator in normal-like breast cancer patients. KIF20A expression correlates with distant metastasis-free survival in patients with luminal B, HER2+ and normal-like breast cancer, but not in patients with basal or luminal A subtype cancer (Mamoor, 2021).
Clinical relevance and potential use of identified genes
in breast cancer test systems
Genes already being used in clinic:
- ERBB2 testing is standard in breast cancer diagnosis and treatment planning (Hilal and Romond, 2016). Targetable ERBB2 mutations are also being explored as markers for personalized therapy(Kurozumi et al., 2020). ERBB2 is part of both BluePrint and Prosigna/PAM50 molecular classification systems for breast cancer subtyping (Krijgsman et al., 2012, Parker et al., 2009).
- CENPA is included in some RNA-based prognostic assays like MammaPrint® and the Molecular Grade Index (MGISM) (Rajput et al., 2011).
- MLPH is part of both BluePrint and Prosigna/PAM50 (Krijgsman et al., 2012, Parker et al., 2009).
- FOXA1 is used in clinical tests to predict prognosis and treatment response (Metovic et al., 2022). FOXA1 is part of both BluePrint and Prosigna/PAM50 (Krijgsman et al., 2012, Parker et al., 2009).
- GRB7 expression is included in the 21-gene recurrence score assay used to predict recurrence in breast cancer (Sparano et al., 2015). GRB7 is part of both BluePrint and Prosigna/PAM50 (Krijgsman et al., 2012, Parker et al., 2009).
- ESR1 mutations are common in metastatic estrogen receptor-positive, HER2-negative breast cancer and are used in clinical tests to predict resistance to estrogen deprivation therapies (link). ESR1 is part of both BluePrint and Prosigna/PAM50 (Krijgsman et al., 2012, Parker et al., 2009).
Genes being investigated as potential biomarkers:
SFRP1 (Wu et al., 2020, Baharudin et al., 2020),
EGFR (Kjær et al., 2020),
LINC00504 (Hou et al., 2021),
STARD3 (Lodi et al., 2023, Korucu and Inandiklioglu,
2024).
Conclusions
- Differential Expression Analysis:
- Significant differentially expressed genes (DEGs) were identified when comparing each breast cancer subtype to healthy samples, with Luminal B showing the highest number of DEGs (24.19%) and Luminal A the lowest (17.25%).
- Significant differentially expressed genes (DEGs) were identified when comparing each breast cancer subtype to other subtypes combined, with Basal-like showing the highest number of DEGs (14.46%) and Normal-like the lowest (0.58%).
- Dimension Reduction and Visualization:
- PCA combined with t-SNE provided the best clustering of PAM50 subtypes, while UMAP captured global tendencies better than t-SNE alone.
- Classifier Performance:
- Random Forest with 100 estimators was chosen for its balance of performance and computational efficiency, achieving an accuracy of 86% and high precision and recall for most subtypes.
- Most of key genes identified through feature importance analysis were found to be biologically relevant and associated with breast cancer prognosis and treatment response.